COVID-19: Key metrics show mixed picture in Hungary


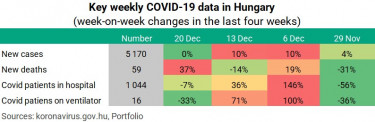
As regards the total number of Covid deaths, Hungary continues to beat everyone in the region. In terms of deaths per one million population Hungary is 3rd in the world, with 5,042 fatalities behind Bulgaria (5,564) and Peru (6,470).
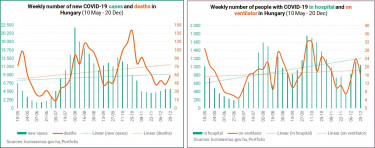
Here are a few charts about the key indicators that show the main developments in the pandemic since mid-May:
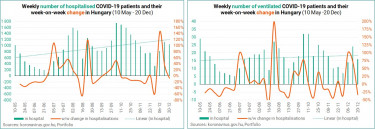
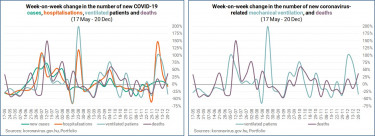
The two below show only the week-on-week changes for the four key metrics.
The 'On ventilator / In hospital' ratio was falling constantly since May, although there was a spike in late August. The ratio has been acting erratically since early November (it was as low as 1.3% and and high as 2.1%). Last week it retreated to 1.5% from 2.1% a week earlier.

The following chart shows the daily average number of Covid deaths as a percentage of Covid patients in hospital and on ventilator. There is a downward trend in the former and a slight upward trend in the latter.

The following chart uses an indicator conceived by Balázs Pártos, an enthusiast with a medical background who was keeping a very close eye on the pandemic and made rather accurate estimates based on the CFR/OCC ratio. CFR = [deaths / confirmed cases], OCC = [deaths / (deaths + recoveries)]. This may be one of the best (simple) indicators as to where the pandemic is headed. The index has dropped for the second consecutive week.

Vaccine uptake remains extremely low.
The average daily number of Covid shots was the highest at 4th jabs (820), followed by 3rd shots or first booster doses (67), while the daily average of 1st and 2nd vaccines was 22 each. In such an environment it is almost futile to bother with the actual figures, but the charts below at least tell a more complex story.


Cover photo: Getty Images