Coronavirus: the Hungarian weekly data is in

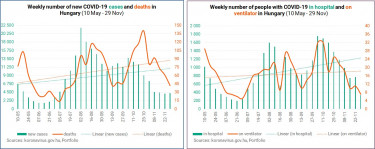
If there's one thing you can say about Hungary's official Covid statistics is that they are consistently hectic. It's enough to take a look either at the following table or the charts below.

At least the daily average of coronavirus-related deaths went down to 6 for the last 7 days from 9 a week earlier.
Here are a few charts about the key indicators that show the main developments in the pandemic since mid-May:


The 'On ventilator / In hospital' ratio was falling constantly since May, although there was a spike in late August. The ratio has been steadily rising since mid-Sept and reached 1.9% in mid-October, only to rather inexplicably drop to 1.1% after and then jump back to 1.8% and drop abruptly again to 1.3% two weeks ago. Last week the ratio edged up to 1.4% and now it jumped to 2.1%. The downward trend remains intact, though.

The following chart shows the daily average number of Covid deaths as a percentage of Covid patients in hospital and on ventilator. There is a downward trend in the former and a slight upward trend in the latter. The number of ventilated patients used in the graph is an adjusted figure, i.e. the official data multiplied by 1.4 to reflect the changes in methodology introduced by local authorities last November (invasive vs. non-invasive ventilation). The pattern looks absolutely the same without the adjustment, only the death/ventilated ratios are higher.

The following chart uses an indicator conceived by Balázs Pártos, an enthusiast with a medical background who was keeping a very close eye on the pandemic and made rather accurate estimates based on the CFR/OCC ratio. CFR = [deaths / confirmed cases], OCC = [deaths / (deaths + recoveries)].

Vaccine uptake slackens
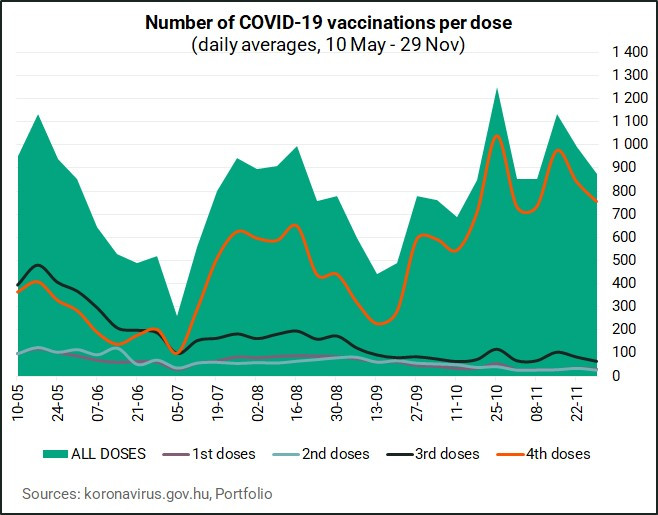
A total of 6,115 COVID-19 shots have been administered in Hungary over the past seven days, down 12% from 6,924 a week ago, which follows a 13% w/w drop.

The daily average dropped further to 874 doses after a 14% decline to 989 a week ago.


The number of 4th doses administered (5.279 or 754 per day) shows a 10% w/w drop, and the number of 3rd jabs administered (480 or 65 per day) shows a 22% decline after a 20% decrease on the preceding week. The daily average of 1st and 2nd shots was 29 and 25, respectively, reaching a total of 206 and 177 over the seven days up to 29 Nov.

Cover photo: Getty Images


