COVID-19: Pandemic in retreat, death statistics keep worsening in Hungary

Highlights of today's data release:
- new cases +49% d/d (it's a trend stemming from the official reports, nothing to worry about), -29% w/w;
- 7-day average of new cases -7% d/d, -34% w/w;
- Covid patients in hospital -277 (-6%) d/d, -703 (-14%) w/w;
- Covid patients on ventilator -4% d/d, -16% w/w;
- Covid deaths +1 (+0.8%) d/d, +35 (+36%) w/w.
At this point in the fifth wave of the pandemic the general population does not care what is happening. The trumpets of victory have sounded, the virus is in retreat, so let's bring out them flutes and fill 'em up with the bubbly golden nectar named after a region in France.

If you want to compare the current pandemic wave with the one a year ago, go ahead. The table above offers the key metrics for you: new cases, hosplitalisations, number of ventilated Covid patients, and deaths (if you scroll down). If you don't want to compare the data, that's also fine, just look at the numbers and curves and columns for this year alone.
Based on 7-day averages, hospitalisations have been dropping at an increasing rate for the fourth day in a row, while the week-on-week growth rate of the 7-day average of the number of Covid patients on ventilator has dropped for the eighth consecutive day row since this metric started to worsen on 28 January.

The number of Covid deaths is still extremely high considering that about 39% of the population (3.8 mn) received three doses of COVID-19 vaccines and about 63% (6.16 mn) had two shots, while a year ago only about 110,000 people had been protected by two doses. The 7-day average of Covid deaths has picked up again.


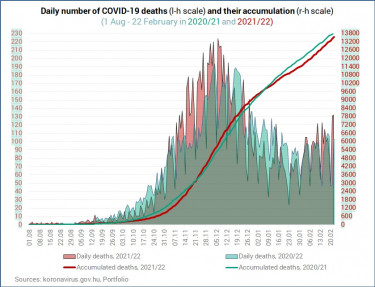
Note that the aggregate number of Covid deaths since 28 August almost matches the number a year earlier which is terrible.


If you were wondering how were were doing in terms of coronavirus-related mortality, here are the daily deaths figures and their accumulation for the period between 1 January and 22 February in 2021 and this year.

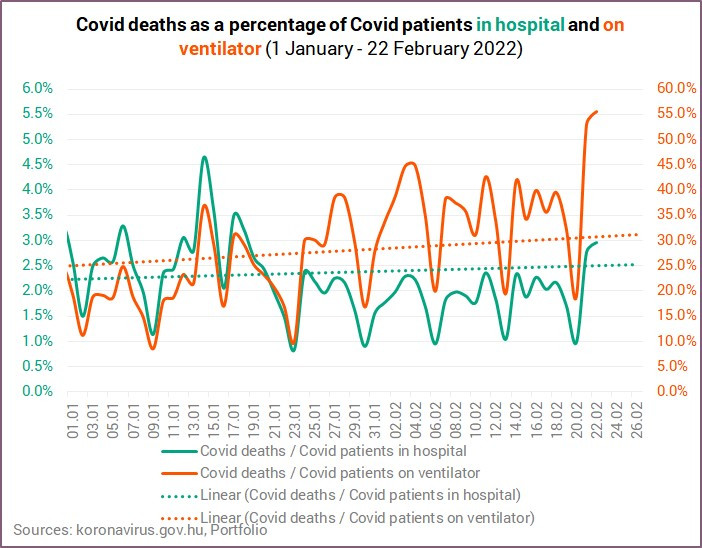
The trend is still slightly ascending, whether we look at the daily death figures or the number of deaths per the number of ventilated coronavirus patients (daily or 7-day averages, it doesn't matter).


Hospitalisation and ventilation stats show improvement any way we look at them.

And as the number of Covid patients in hospital and on ventilator drops, and daily deaths rise, we get the following dramatic ratios.

How to read the following chart?
On the two charts below the 0% line is important. When the curves are under 0% there’s a decline, when they go over 0% it’s an increase.
More importantly, when a value is north of 0% but the curve descends, it means an increase at a slowing rate, rather than a decrease. If the curve is above 0% and ascending, it is an increase at an accelerating rate. When we are under 0% and the curve goes lower, it translates into an accelerating decrease, and when it goes up it marks a decelerating decrease.

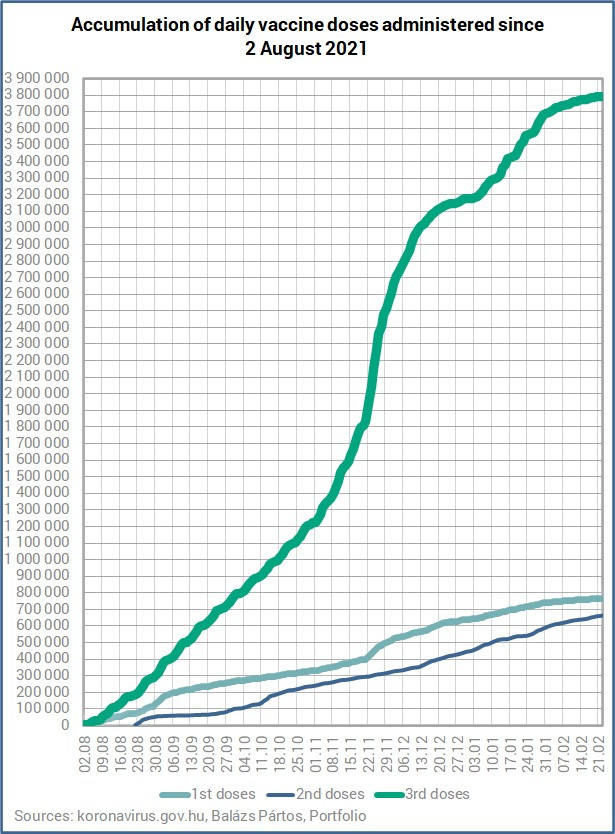
With the pandemic clearly subsiding, Hungarians willingness to get vaccinated against SARS-CoV-2 dwindles further.
The 7-day average is 859 for 1st doses, 2,218 for 2nd and 2,992 for 3rd shots.

Cover photo: Getty Images


