Coronavirus keeps spreading at an accelerating rate in Hungary

The 7-day rolling average of daily new confirmed COVID-19 cases is already higher than a year ago, but fortunately the 7-day rolling average of coronavirus-related fatalities is not as deadly (yet) in this 'wave'.
The percent positive rose to 16.52%, with 3,125 new cases, 1,798 people in hospital, including 197 on ventilator, which compare with a 17.75% test positivity rate, 2,079 new cases, 2,891 hospitalised Covid patients, with 243 of them on ventilator a year ago. The 3-day average percent positive is already higher than a year ago at 15.92% vs. 15.43%. It has not been this high since mid-April.


Let's compare the current situation to the one we were in a year ago. There are about 38% fewer Covid patients in hospital but only some 19% fewer on ventilator, which indicates that those that need medical help are generally in a more severe condition. This also has to do with testing practices. Underdetection is massive. Given that there were no vaccines a year ago (about 60% of the population are inoculated now, but this coverage is unlikey to go much higher) the charts below bode ill for the future.
And now there's the issue of the waning effectiveness of vaccines, about which we have just published an article. (Click on link below!)

The government relies solely on vaccination, whereas international example show that the best defence is a mixture of vaccination and restriction measures (curfew, closure of services, mask-wearing, use of vaccination certificates, etc.).


Looking at how the situation of hospitals worsened in past weeks, we find that
THE LOAD ON COVID WARDS IS INCREASING AT THE SAME PACE AS IT DID THIS TIME LAST YEAR.
The number of people requiring hospital treatment is growing by 100 a day and an additional 9 people require ventilation each day (based on the seven-day rolling average). This is disheartening as vaccination was supposed to bring great results.

In terms of Covid deaths per the accumulated number of days spent in hospital (l-h scale), the situation is almost as bad as a year ago (1.70% currently vs. 1.78%), but in terms of fatalities per the accumulated number of days spent in ICUs (r-h scale) we are still better off than a year ago.

On the left-hand chart we can see that the number of COVID-19 patients in hospital was largely the same in 2020 and this year up until mid-September (3-day averages). Thanks to vaccination coverage the number this year should not have been even half of what we had last year, especially if cross-immunity gained earlier (in the previous waves or epidemics) work. Our 'advantage' currently is only 36%.
On the right-hand chart, the ratio of days spent in hospital to the accumulated number of COVID-19 cases is 79.8% (pinkish columns), while it was almost 89%% last year (green area). The turnaround occured on 21 October, as the 2021 ratios have been constantly higher since late August, which meant that more Covid patients should have been in hospital to match those ratios.
The number of days spent on ventilator relative to the accumulated number of new cases was 7.7% last year (green curve), while it is 10.8% this year (red curve).

The left-hand chart depicts the accumulated number of confirmed daily COVID-19 cases and days spent in hospital by coronavirus patients. The accumulated number of new cases in the period under review is about half what we had a year ago. Up until 22 September, those admitted in hospital stayed there longer than in the base period, but then the trend changed.
The number of accumulated cases (between 28 August and 26 October) is about 25% (43,400) of what we had last year (cc. 58,100), but the gap is closing. Meanwhile, the accumulated number of days spent in hospital is about 33% lower.
On the right-hand chart you find that the both curves (accumulated number of new cases) keep more or less parallel with the columns, only the 'wrong' columns. The columns show the accumulated number of days COVID-19 patients spent on ventilator (much more this year) but what the relation between the curves and the columns tell us is that there should be way more cases and a lot more hospitalised patients for this kind of overall severity of cases.

The right-hand chart also attests that there hospitalised Covid patients are in more severe condition this year than a year ago. Whereas the patients spent fewer days in hospital, they spend more time in ICUs.

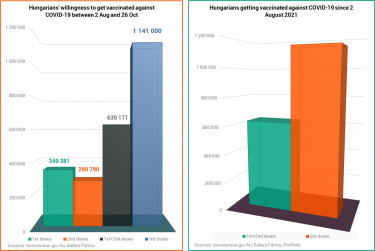
There is no change in the trend of vaccine uptake. Third doses remain more in demand than first and second doses combined, but considering the waning effectiveness of COVID-19 vaccines, even this demand would need to increase, otherwise the actual immunity of the population to infection will drop from current levels.


