30% more Covid patients need ventilation than a year ago in Hungary

Even if it was about the number of new confirmed daily COVID-19 cases, August and September this year would look a lot more dramatic than in 2020. But it's not.

The number of new confirmed daily COVID-19 cases was three times as high a year ago (289 vs. 876), while only 13% fewer people are in hospital (401 vs. 463), and 30% more of them need mechanical ventilation (45 vs. 35).

The following charts show 7-day averages of new cases and Covid deaths compare between 27 July and 20 September in 2021 and 2020.
Purely on the basis of COVID-19 cases we are better off than a year ago, while in terms of fatalities the picture is largely the same, although it was clearly worse in the first two weeks.

What about testing? Yeah, nah.
We can basically forget about testing. Our solid assumption is that only those that show severe symptoms of SARS-CoV-2 get tested. There have been reports that GPs are – on orders ’from up high’ – are reluctant to request COVID-19 tests unless they find it absolutely necessary. The negative tests are most likely related to voluntar testing (for work or travel). This is all a guess, by the way, we don’t actually know who are tested and on what condition. (Also note that testing may very well not help. Just look at Israel that performs at least ten times as many tests per day than Hungary and yet it has had a record number of new cases, including severe ones and deaths.


On 20 September 2021, about 10,000 tests yielded 289 positive cases, while 876 positive cases were detected in just as many samples a year earlier.
The 3-day/21-day ratio rose to over 118%, and the 7-day average of the 3d/21d ratio is over 120%.


The 3-day average test positivity rate at 3.0% compares with 6.6% a year ago.
That’s less than half, while the same number of people are in hospital and more of them are on ventilator.
Covid patients in hospital, on ventilator
The 3-day average ratio of COVID-19 patients on ventilator to the number of people hospitalised with coronavirus infection stood at 11.6% on 20 September 2021 versus 7.8% a year ago. The 7-day average of 11.8% compares with 7.0%.
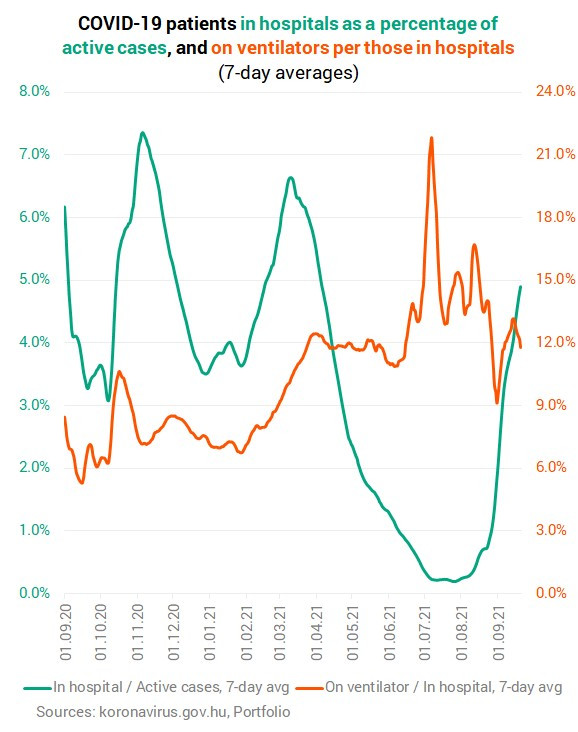
The following charts show how the changes of the key hospitalisation figures (l-h) and how the changes have been changing (r-h).

The four charts below show the absolute number of COVID-19 patients in hospitals and on ventilators (top two) as well as two ratios (COVID-19 cases in hospital / Active cases, and COVID-19 cases on ventilator / Cases in hospital, bottom two.) The left-hand charts depict a longer period (15 June - 20 Sept), while the right-hand ones show changes over a shorter period (25 July - 20Sept). The ascending trend is clear as regards the number of people in hospital and on ventilator.

The charts below show that the percentage (3-day average) of those requiring artificial ventilation of those that are in hospital with COVID-19 dropped in the second half of last week, but it is sligthly up again at 11.6% (7.8% a year ago). Overall, the number of new patients in more severe condition has been rising sharply, and so has the hospitalisation of active cases, and there's an even more dramatic rise in ICU cases, which would eventually lead to more people on ventilators and more deaths than a year ago.

Here are another four charts for comparison.
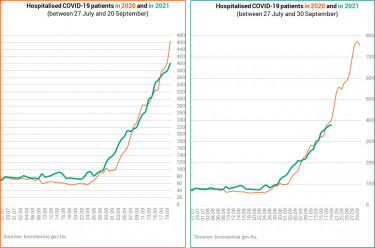
There are 401 people in hospital with coronavirus infection, some 13% fewer than a year ago (463). With the vaccines and cross-immunity this number (or the number of people on ventilator for that matter) should not be this high. There were 700-800 people with COVID-19 in hospital at the end of September last year. Theoretically, there should be half or even less this year.

The most likely explanation is that unvaccinated people make up the majority of severe cases, but authorities do not disclose the number or percentage of vaccinated and unvaccinated people among the infected / hospitalised / ventilated people.
Given that the cabinet relies almost exclusively on vaccines and has virtually no restriction in place that would mitigate Covid risks and help stem the spread of the more contagious Delta variant, it is incomprehensible why these numbers are not released. Provided they would prove that vaccines work and if you don't get inoculated against coronavirus, your chances are much higher of getting infected, having severe symptoms, needing hospitalisation and possibly ending up on tubes and then in the morgue.
Vaccinations
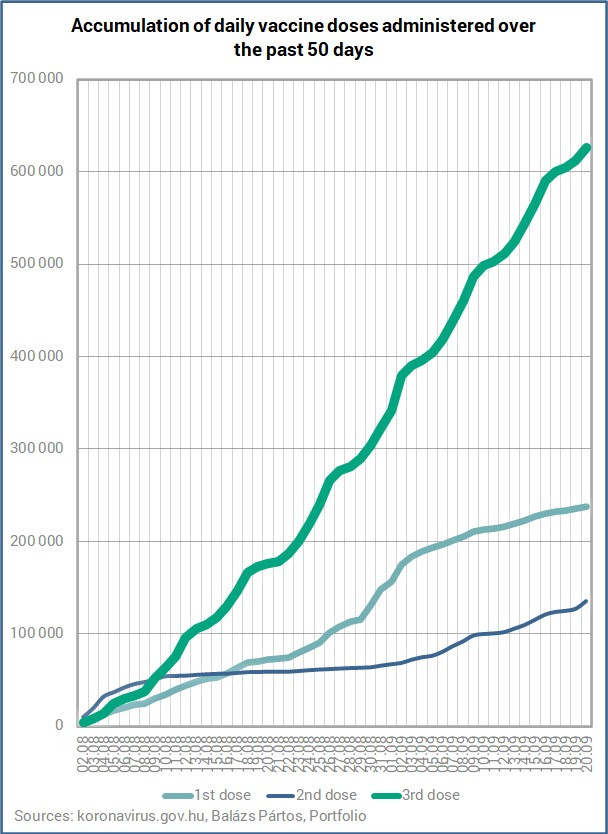
Vaccinations continue at a snail's pace. Between 2 August and 19 September:
- 238,000 people got their first dose of a COVID-19 vaccine;
- 135,500 people got their second dose of a COVID-19 vaccine; and
- 626,000 people got their third dose of a COVID-19 vaccine.




Let's talk about quarantine
The number of people in mandatory quarantine and their relation to the number of active cases is a fascinating study when comparing this ‘wave’ with the one a year ago. It says a lot about (i) the artificial nature of the 'Active cases' figure, (ii) the seriousness by which authorities treat the pandemic.
The recording of active cases does not keep track of the actual number of people with COVID-19, and there were drastic reclassifications from active to recovered status.
On 1 September, there were ‘only’ 4,824 active cases versus 30,000 on 1 August, about 39,000 on 1 July and 70,000 on 1 June.
And then practically no more people were left with 'old' active status to reclassify. This shows in the numbers and has already led to a constant rise in the number of active cases. (Active cases = [Total confirmed cases-Recovered-Deceased].)
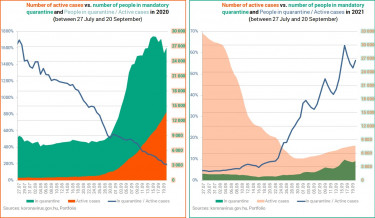
The first thing that strikes you when looking at the charts below is probably the slant of the blue curves; one is descending, while the other one is ascending.
The left-hand chart shows what happened in this respect in between 27 July and 20 September 2020 and the one on the right shows data for the same period this year.
On the left we find that last year a lot more people were in quarantine than how many were in active status and their ratio was as high as 1,700% in late July and dropped to under 200% on 20 Sept. In late July this year, though, the number of active cases was as high (actually, even higher) than the number of people in quarantine a year earlier, whereas only about 1,500 people were in quarantine, against 8,500 a year earlier.
Then the number of active cases was (artificially) lowered right until early September, while the number of people in quarantine started to go up on 22 August. The highest point in the In Quarantine / Active cases ratio was reached at 63% this year (16 Sept.) and at 1,700% a year earlier (27 July) in the 27 July to 20 Sept period.
Cover photo: Lászlo Szirtesi/Getty Images


